
In this map I’ve applied a Low-Pass filter to remove unwanted noise from a hillshade of a DEM of Mount Shasta and then used Map Algebra in the Raster Calculator to combine the filtered hillshade with an unfiltered hillshade to replace areas where detail was lost. I then applied and fine-tuned a stretched symbology treatment to give the impression of a snow-capped peak.
Tag: GIS
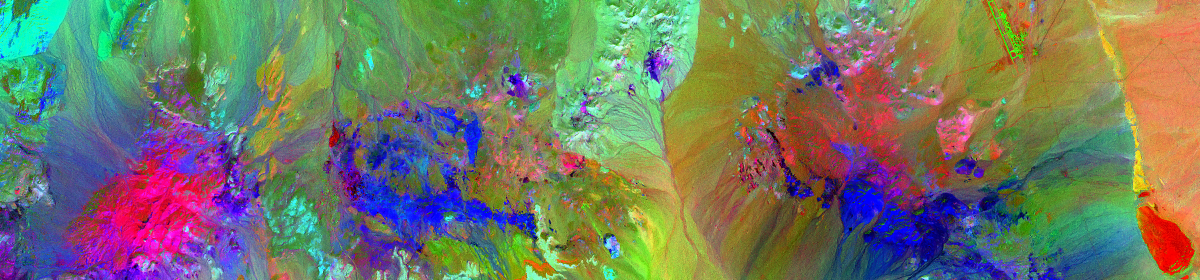
Wildfire Risk Analysis

Increased risk for wildfire is associated with West, Southwest & South facing landscapes with slopes of 60 percent or greater. Starting with a USGS 7.5 minute DEM, I applied Hillshade and Aspect analyses and used Raster Calculator conditional statements to isolate the areas that matched the risk factors. This map shows those slopes that match one or both risk factors.
Viewshed Analysis

This is a viewshed analysis for 4 proposed cellular antenna tower locations in Walnut Creek, CA. Individual tower viewsheds can be seen in the main map area and total viewshed area for all 4 locations is shown in the inset. Basemap is a USGS 7.5 minute Digital Elevation Model with Hillshade.
ArcGIS.Com storymap – Micro-climates in the San Francisco Bay Area

Link to map: http://arcg.is/2hngpiH — I created this storymap using ArcGIS Pro and ArcGIS.com with some assets hosted on Amazon’s AWS S3. This is actually 2 storymaps in one – the time-aware map on the right is nested into the parent shell that provided the section links on the left. This map shows changes in temperature, precipitation, wind-speed and wind-direction at 9 different weather stations in the San Francisco Bay Area over a 13 month period from September 1, 2014 to September 30, 2015.